Common in media environments
89
Especially strong where repetition and vivid storytelling dominate attention.
Rare
Frequent

Cognitive Biases
A practical cognitive-bias site with clear definitions, learning paths, assessments, self-audits, and debiasing tools.
Cognitive Bias
The tendency to judge frequency, risk, or importance by how easily examples come to mind.
What it distorts
It turns memory accessibility into a mistaken proxy for prevalence or probability.
Typical trigger
Recent news cycles, memorable anecdotes, dramatic failures, and repetition.
First countermove
Ask for a base rate or outside-view frequency before trusting the vivid example.
Best use
Quick reset
Does this feel common because it is frequent, or because it is vivid and easy to retrieve?
Vivid, recent, repeated, or emotionally loaded cases are easier to retrieve, so they feel more common and more representative than they are.
These are classroom-facing editorial estimates for comparing how the bias behaves in use. They are teaching aids, not measured statistics.
Common in media environments
89
Especially strong where repetition and vivid storytelling dominate attention.
Easy to spot from outside
58
Often visible once the missing denominator is named.
Easy to innocently commit
84
The most available example usually feels like the responsible place to begin.
Teaching difficulty
34
Very teachable once examples are contrasted with base rates.
This comparison makes the hidden pull easier to see before the technical label has to do all the work.
Biased move
This is like estimating a city's climate by remembering only the days dramatic enough to photograph.
Clearer comparison
What comes to mind fastest is not always what happens most often. Easy recall can be a salience measure rather than a prevalence measure.
Do not use this label whenever an example is mentioned. Examples are often useful. The problem begins when vivid recall is allowed to stand in for a wider frequency check.
Use this label when a memorable anecdote, headline, or recent event starts doing the work that rates, denominators, or broader sampling should have done.
Use the quick check, caveat, and nearby confusions together. The fastest diagnosis is often the noisiest one.
Each example changes the surface context while keeping the same hidden distortion in place.
After hearing about one burglary on the block, a family sharply overestimates how likely a break-in is this week.
A team redesigns an entire process around the most recent embarrassing outage while underweighting quieter, more frequent sources of loss.
A dramatic airplane incident dominates attention and makes routine but deadlier risks seem comparatively trivial.
If you can picture it vividly, it starts to feel common, urgent, and representative.
Teaching note: This bias is especially useful for media literacy because it shows how attention is not the same thing as prevalence.
The strongest debiasing moves change the process, not just the label.
Pause before the anecdote and write down the reference class you actually need.
Make people bring denominator data when they bring a vivid story.
Design dashboards around rates and trend lines instead of exceptional incidents alone.
Practice And Repair
The drift here is from vividness to representativeness. The mind does not announce that shift. It just makes the memorable case feel like the normal case.
A dramatic, recent, emotionally loaded, or repeated example enters attention faster than the wider distribution.
Because the example comes to mind quickly, it starts to feel like the most relevant evidence for how common or likely the event is.
Judgment about prevalence, risk, or importance gets organized around recall strength rather than sampling quality.
Write the vivid case down, then place a rate, denominator, or reference class next to it before drawing the broader conclusion.
What evidence would tell me how common this really is rather than how easy it is to remember?
Spot It
Slow It
Reframe It
These distinction guides slow down the most common nearby-label confusions before the diagnosis hardens.
Availability mistakes ease of recall for prevalence; frequency illusion makes newly noticed things seem suddenly common.
Quick rule: Ask whether the item is easy to recall because it is vivid, or newly salient because attention has been tuned to it.
These are nearby labels that can share the same outer appearance while differing in what actually drives the distortion. Use the overlap, the distinction, and the diagnostic question together before settling the call.
Why compare it: Negativity bias explains why threats and losses become especially memorable; availability explains how that memorability becomes a faulty estimate.
Why compare it: Base-rate neglect is the failure to anchor on prior odds; availability is one reason vivid cases displace those odds.
Why compare it: Survivorship bias distorts which cases are visible; availability describes how the visible cases then dominate judgment.
These are useful when the label seems roughly right but the process change still feels underspecified.
What would the boring spreadsheet say here?
Am I tracking frequency, or just ease of recall?
Which quiet cases are missing because they never became memorable?
These sourced cases do not prove what was in someone's head with perfect certainty. They are teaching cases for showing where the bias pressure becomes visible in practice.
Letter-frequency judgments in classic availability research
People often judge letters to be more common in the first position of words than in later positions because first-position examples are easier to retrieve.
Why it fits: Retrievability quietly substitutes for actual frequency.
1973
Risk perception after vivid disasters
Highly publicized disasters can make rare risks feel more representative than routine but deadlier alternatives.
Why it fits: Salience changes felt risk faster than the underlying distribution changes.
Modern examples
Dramatic causes of death feel more common than statistical causes
Tversky and Kahneman's availability work helps explain why dramatic, memorable causes can feel more frequent than quieter statistical causes.
Why it fits: Ease of recall is being used as a proxy for real-world prevalence.
Availability heuristic research · 1973
These linked tools turn the page into practice instead of leaving it at the level of definition.
2 related paths place this bias beside the distortions it most often travels with in practice.
Direct path
Use this path when you want the minimum set of pages that gives the rest of the site immediate traction.
Direct path
Use this path when you suspect that the apparent evidential picture is itself distorted.
These short audits help catch this bias before it hardens into a verdict, forecast, or decision.
Direct audit
Is this memorable because it is representative, or because it is dramatic and easy to circulate?
Direct audit
What did the surprise reveal about the world, and what did it reveal about my forecasting habits?
This bias is featured in a printable lesson or workshop packet.
Direct workshop
A 45-minute lesson for separating vivid stories, repeated claims, and missing denominators before a news item becomes belief.
2 mixed scenarios let you diagnose this bias from the case rather than the heading.
Direct scenario
The headline that feels like the trend
After two heavily covered shark attacks, a family starts talking as if beach vacations have become unusually dangerous in general, even though they have not looked at any broader…
Direct scenario
The clip that became the crime rate
After several vivid subway-crime clips circulate, a group chat starts talking as if the entire transit system has become much more dangerous, although no one has checked trend dat…
These links widen the frame around the bias without interrupting the core lesson on this page.
A practical article on why cognitive biases often shape what feels plausible before anyone states a neat argument aloud.
CogBias theory
A theory article on how repetition, uptake, and residue can make weak claims feel progressively more settled without substantially improving the evidence underneath them.
CogBias theory
These neighbors were selected from shared categories, shared patterns, and explicit editorial links where available.
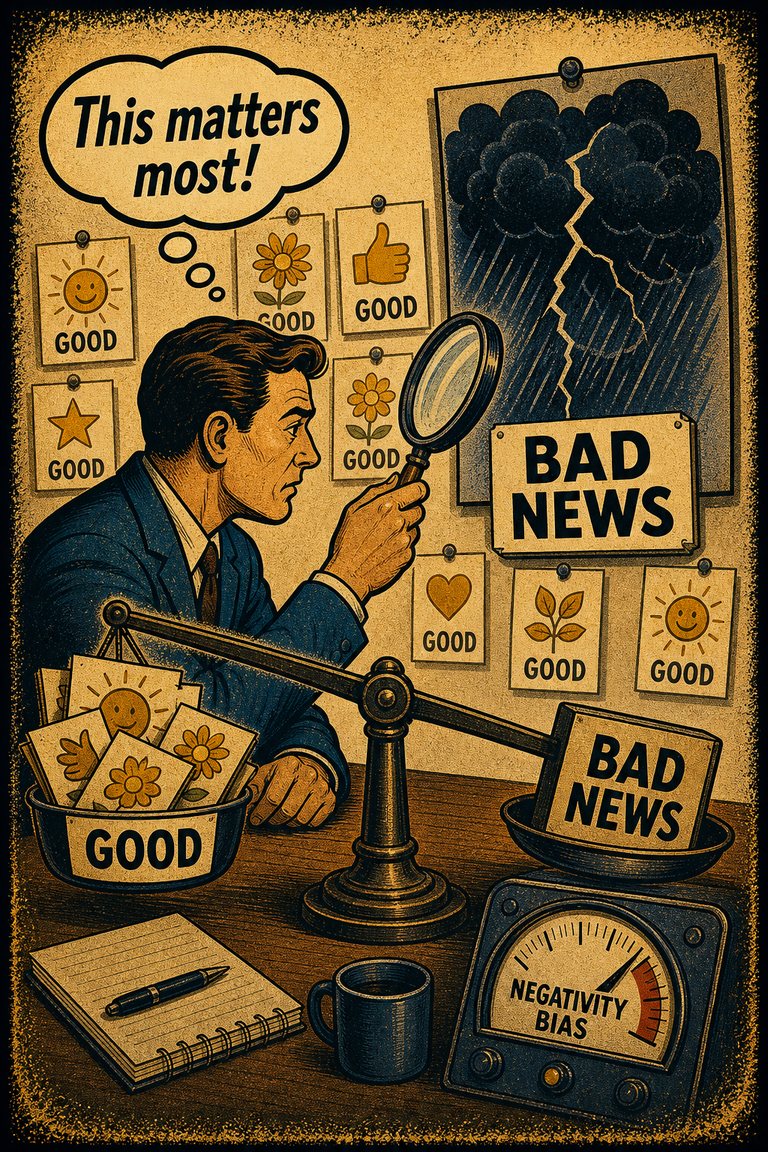
The tendency to give bad news, threats, criticism, and losses more psychological weight than equally sized positives.
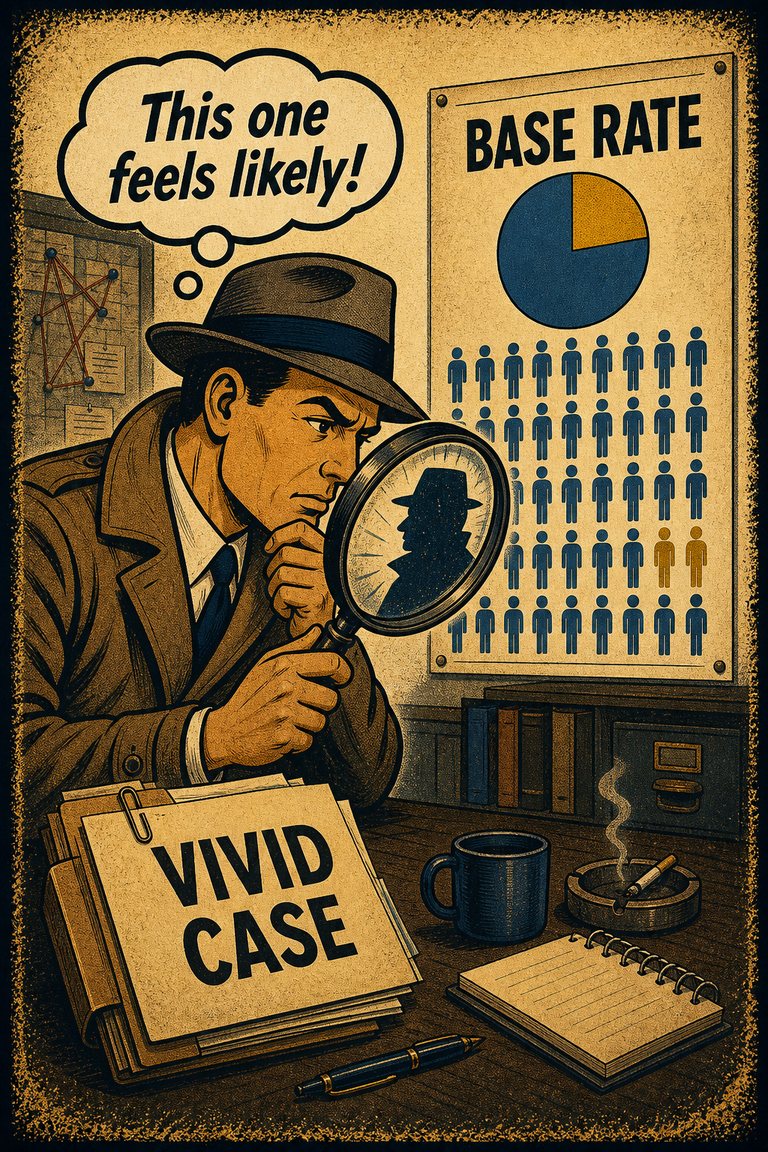
The tendency to underweight general prevalence information when vivid case-specific details are available.

The tendency to learn from the visible winners while overlooking the invisible failures that dropped out of view.
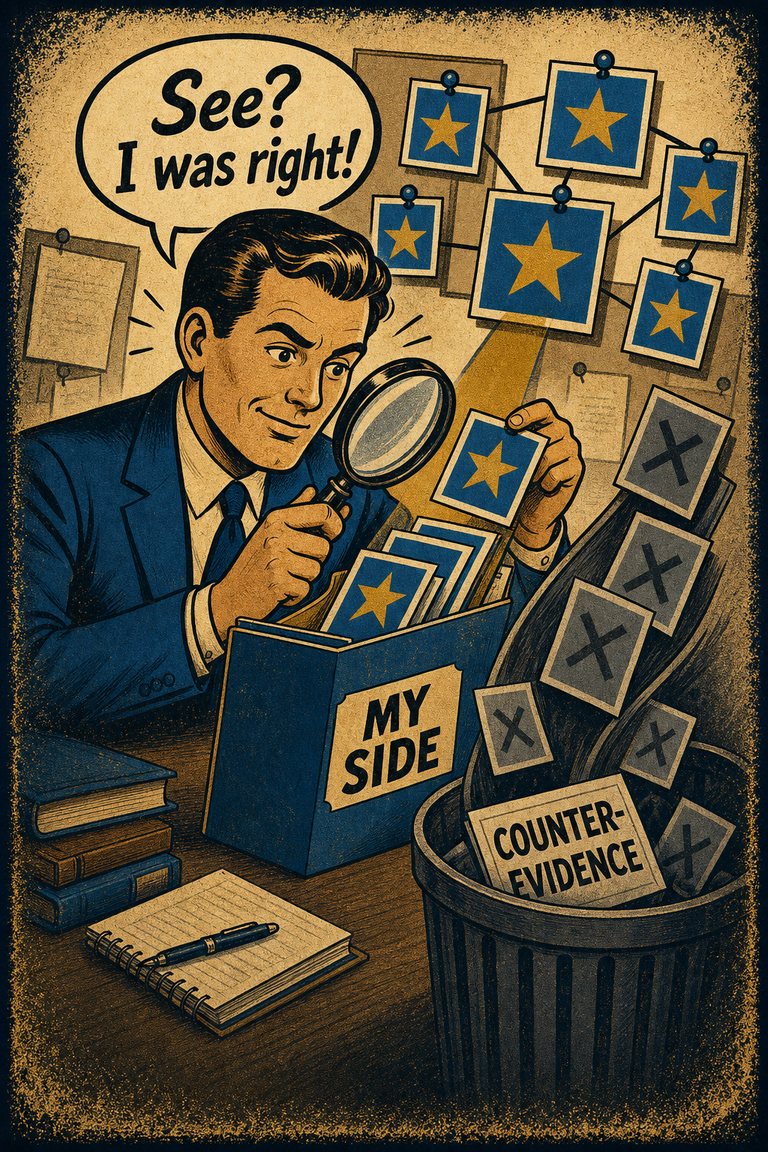
The tendency to notice, seek, and remember evidence that supports the story you already prefer more readily than evidence that threatens it.
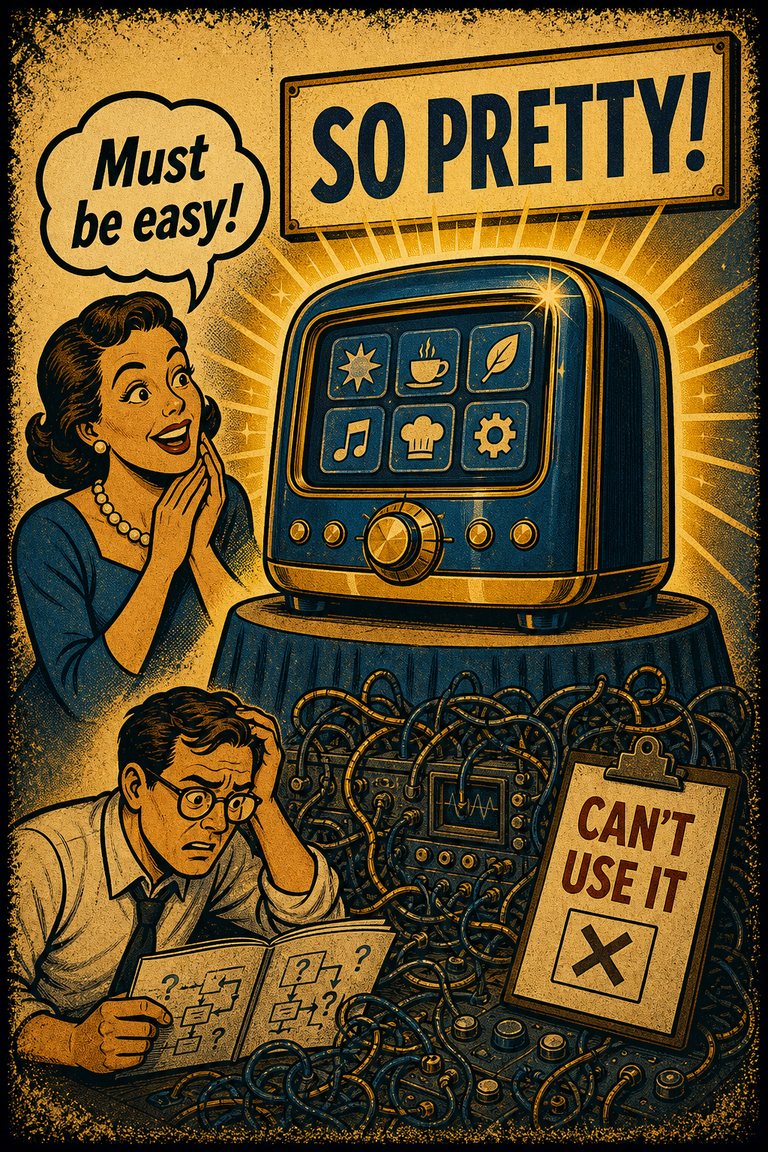
The tendency to treat attractive things as more usable than they really are.
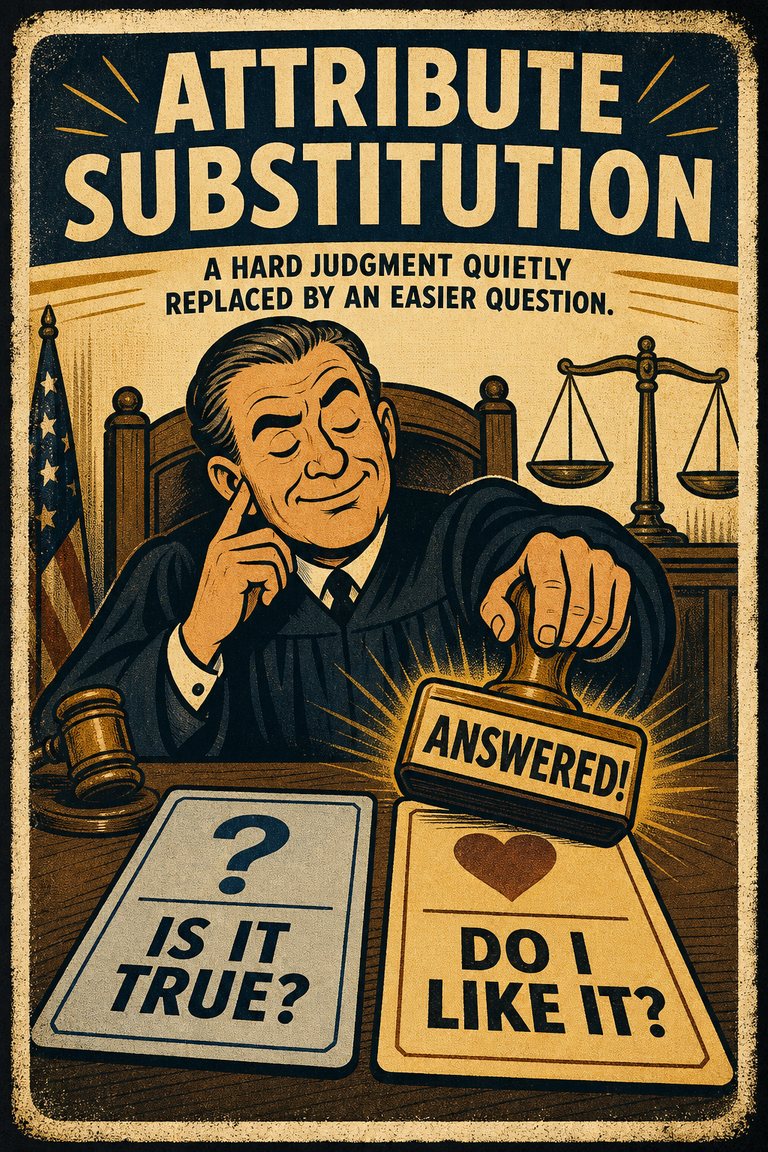
The tendency to answer a hard judgment question by unconsciously substituting an easier one.