Common in data storytelling
77
Strong in maps, dashboards, sports runs, and public-risk narratives.
Rare
Frequent

Cognitive Biases
A practical cognitive-bias site with clear definitions, learning paths, assessments, self-audits, and debiasing tools.
Cognitive Bias
The tendency to overestimate the importance of small runs, streaks, or clusters in large samples of random data (that is, seeing phantom patterns)
What it distorts
Biases that skew how people interpret evidence, test explanations, and evaluate claims.
Typical trigger
Situations where hypothesis assessment is already difficult and the outcome cue feels easier to trust than a fuller review.
First countermove
Start with the hypothesis assessment question instead of the first intuitive answer, then check whether the outcome pattern is doing invisible work.
Best use
Quick reference
How surprising would this cluster look if the underlying process were random but uneven in the short run?
In hypothesis assessment problems, the result of an event bends how the process, evidence, memory, or explanation is interpreted afterward before a fuller check catches up.
These are classroom-facing editorial estimates for comparing how the bias behaves in use. They are teaching aids, not measured statistics.
Common in data storytelling
77
Strong in maps, dashboards, sports runs, and public-risk narratives.
Easy to spot from outside
54
Often visible as soon as the missing baseline question is named aloud.
Easy to innocently commit
84
The eye treats visible concentration as if it were already an explanation.
Teaching difficulty
38
Very teachable with simple streak and map examples.
This comparison makes the hidden pull easier to see before the technical label has to do all the work.
Biased move
This is like circling a few adjacent raindrops on a window and deciding the weather was trying to draw a route.
Clearer comparison
Randomness routinely produces pockets and streaks. A cluster becomes evidence only after it clears a baseline for how much clumping chance alone can generate.
Do not use this label whenever someone notices a genuine hotspot. Some clusters are real signals. The issue is that visual concentration is being mistaken for evidential surprise before the random baseline has been consulted.
Use this label when a local streak, pocket, or concentration is being treated as self-explanatory even though no one has asked whether random sampling could have produced it.
Use the quick check, caveat, and nearby confusions together. The fastest diagnosis is often the noisiest one.
Each example changes the surface context while keeping the same hidden distortion in place.
A basketball fan sees two missed calls in a row and starts reading the sequence as proof that the referees are now leaning against one team.
A manager notices three bugs from the same subsystem in one week and starts talking as if that module must be uniquely cursed, even though the overall distribution is still thin.
People scan a noisy map of disease cases or crimes and treat a visible cluster as an obvious causal hotspot before checking whether the apparent pattern exceeds what randomness can produce.
A few nearby hits start to feel too patterned to be accidental, so the pattern itself gets treated like evidence.
Teaching note: This is one of the best long-tail entries for showing that the mind is often allergic to leaving randomness alone.
The strongest debiasing moves change the process, not just the label.
Ask what the same dataset would look like if chance alone produced a few streaks and pockets.
Require a random-baseline comparison before the room turns a cluster into a cause.
Build dashboards that show expected variation bands so natural noise is not constantly narrativized as signal.
Practice And Repair
Clustering illusion is a reminder that randomness is allowed to look streaky, lopsided, and narratively tempting in the short run.
A short run, visual pocket, or repeated local feature jumps out against a noisy background.
Because the cluster is easy to point at, it begins to feel too orderly to be accidental.
Pattern visibility gets substituted for statistical surprise, and explanation starts before comparison.
Ask what the same process would be expected to look like under chance and whether the observed cluster meaningfully exceeds that expectation.
What baseline or simulation would tell me whether this cluster is actually unusual rather than merely easy to notice?
Spot It
Slow It
Reframe It
These are nearby labels that can share the same outer appearance while differing in what actually drives the distortion. Use the overlap, the distinction, and the diagnostic question together before settling the call.
Why it looks similar: Both reward the mind for finding structure in noise.
Key distinction: Clustering illusion is narrower. It overreads local runs or pockets in the observed data. Apophenia is the broader habit of discovering significance in much looser coincidence and connection.
Ask: Am I reacting to one suspicious-looking cluster, or to a much wider web of meaning that extends beyond the cluster itself?
Why it looks similar: Both begin with a streak or lopsided short run that feels psychologically loaded.
Key distinction: Clustering illusion overstates what the observed run means. Gambler's fallacy adds a mistaken forecast that the next event must compensate for it.
Ask: Am I only overreading the run I already saw, or am I also predicting a balancing correction in what comes next?
Why it looks similar: Both can make a richer, more story-like pattern feel more convincing than the bare statistics deserve.
Key distinction: Conjunction fallacy mistakes descriptive richness for probability. Clustering illusion mistakes visible local pattern for statistical significance.
Ask: Is the error coming from the attractiveness of the story, or from treating a concentrated run as stronger evidence than it is?
These are useful when the label seems roughly right but the process change still feels underspecified.
What would this pattern look like if the data were random but unevenly distributed by chance?
Am I seeing a meaningful cluster or just a cluster vivid enough to demand a story?
What comparison set would tell me whether this run is actually unusual?
These sourced cases include a few closely related examples where that helps make the same pressure visible in practice.
Disease maps and apparent hotspots
Clustering illusion is often taught through maps of disease, crime, or defects where visually concentrated points are treated as obvious causal hotspots before chance clustering has been compared.
Why it fits: The local concentration feels explanatory on sight even though randomness can produce pockets that invite overconfident stories.
Overview case
Belief-bias syllogism studies
People often judge invalid syllogisms as valid when the conclusion seems believable, and valid ones as weaker when the conclusion seems implausible.
Why it fits: Believability is quietly grading the argument instead of merely following it.
Related through: Belief bias
Modern reasoning research
These linked tools turn the page into practice instead of leaving it at the level of definition.
2 related paths place this bias beside the distortions it most often travels with in practice.
Direct path
Use this path before a major project, strategy choice, or resource commitment.
Direct path
Use this path when you suspect that the apparent evidential picture is itself distorted.
These audits combine direct and nearby checks so you can test the label itself and the broader judgment pattern around it.
Direct audit
What would the outside view say before the inside story takes over?
Same audit family · Public claims and repetition
Is this memorable because it is representative, or because it is dramatic and easy to circulate?
This bias is not yet the named center of its own kit, but it already appears in nearby workshop material that teaches the same pressure in context.
Same workshop family · Public claims and repetition
A 45-minute lesson for separating vivid stories, repeated claims, and missing denominators before a news item becomes belief.
There is no dedicated scenario for this bias yet, but these nearby cases test the same kind of pressure and repair move.
Same scenario family · Public claims and repetition
Research with a favorite answer
A manager asks for evidence about remote work, opens five articles supporting the policy she already prefers, and stops there because the picture now feels clear enough.
Same scenario family · Evidence and explanation
The conclusion sounds right, so the argument must be fine
A student nods along with a weak argument because the conclusion matches what she already thinks is obviously true, and only later notices that the premises did not actually suppo…
These neighbors were selected from shared categories, shared patterns, and explicit editorial links where available.
The tendency to accept vague, flattering, or generic descriptions as uniquely accurate of oneself.
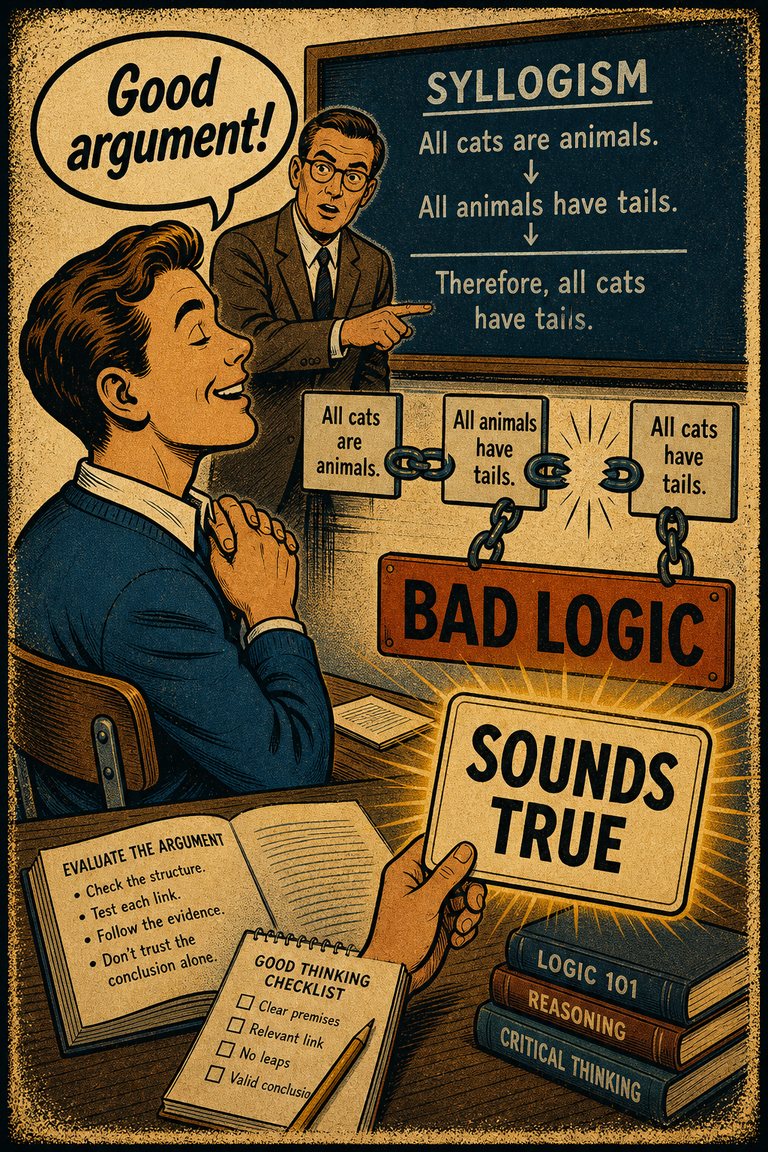
The tendency to judge an argument as stronger when its conclusion seems believable and weaker when its conclusion seems unbelievable, even if the reasoning structure is unchanged.
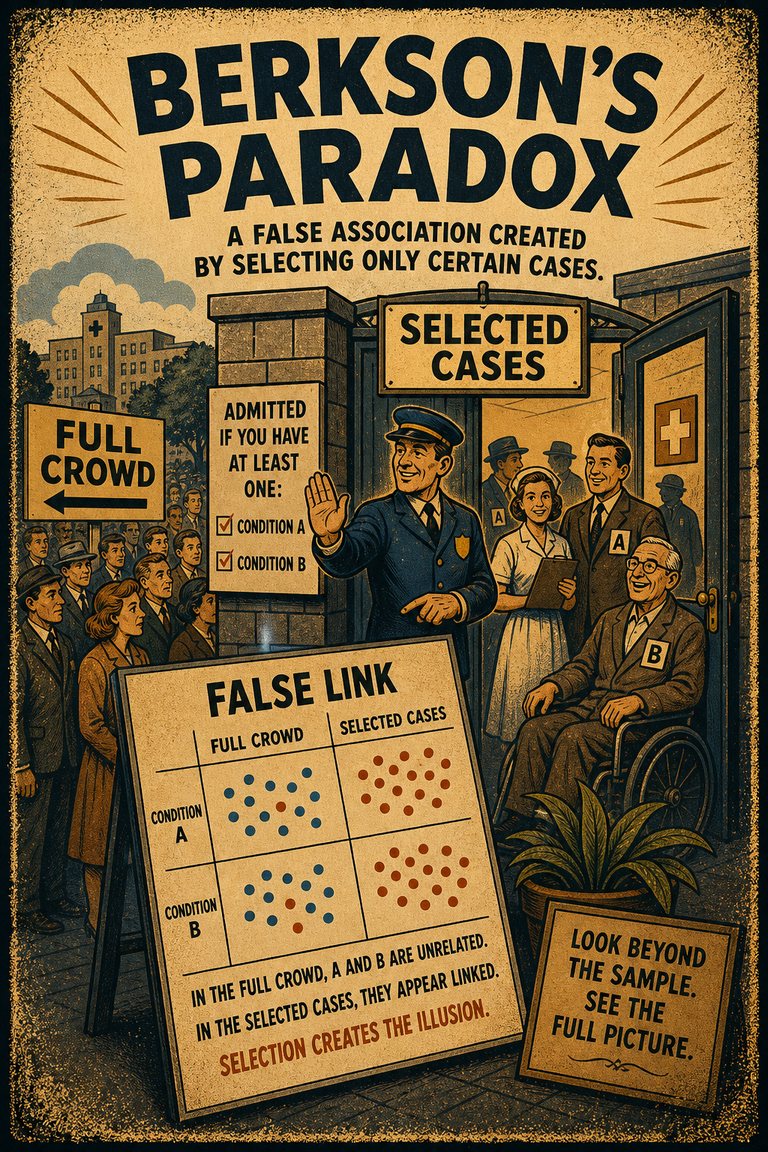
The tendency to draw misleading statistical conclusions from conditionally selected samples.
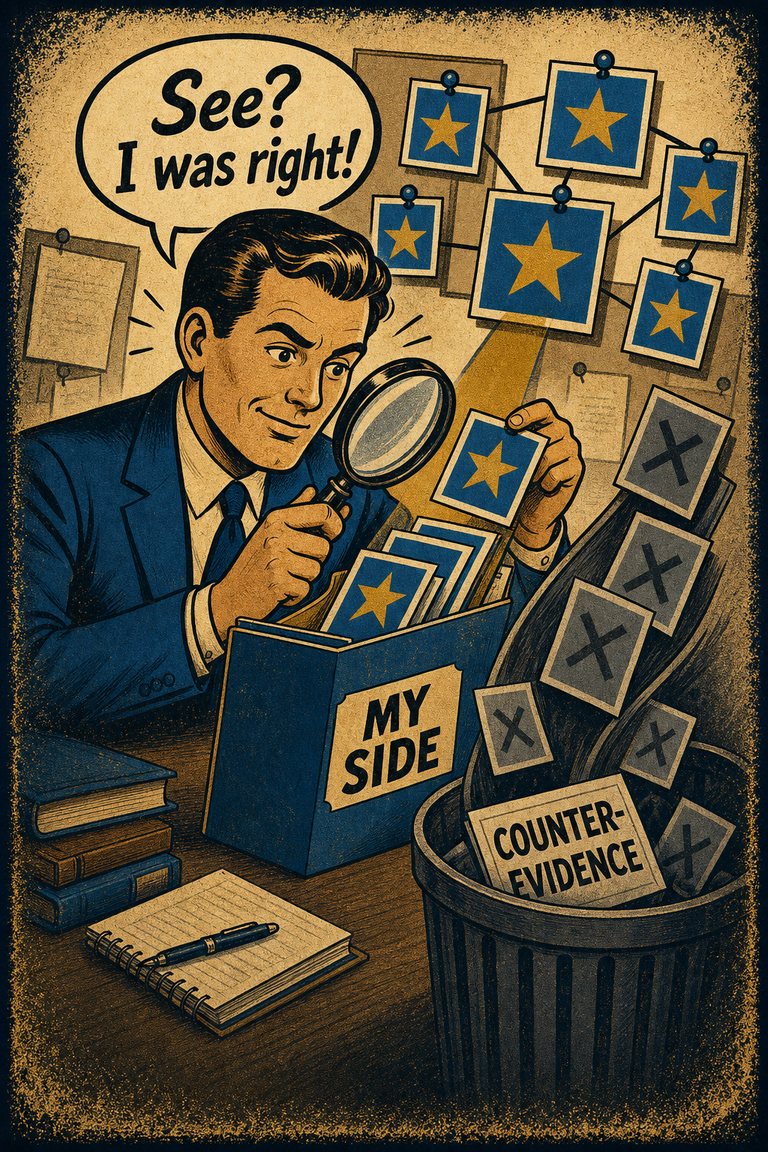
The tendency to notice, seek, and remember evidence that supports the story you already prefer more readily than evidence that threatens it.
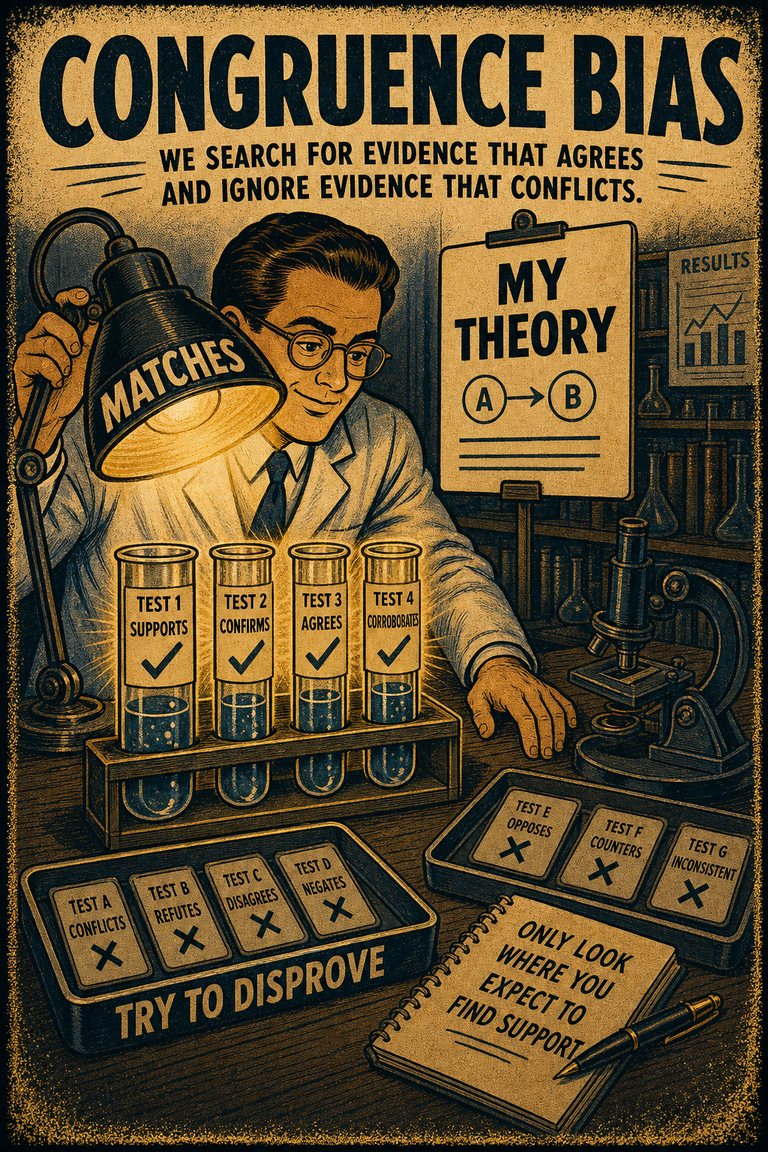
The tendency to test hypotheses exclusively through direct testing, instead of testing possible alternative hypotheses.
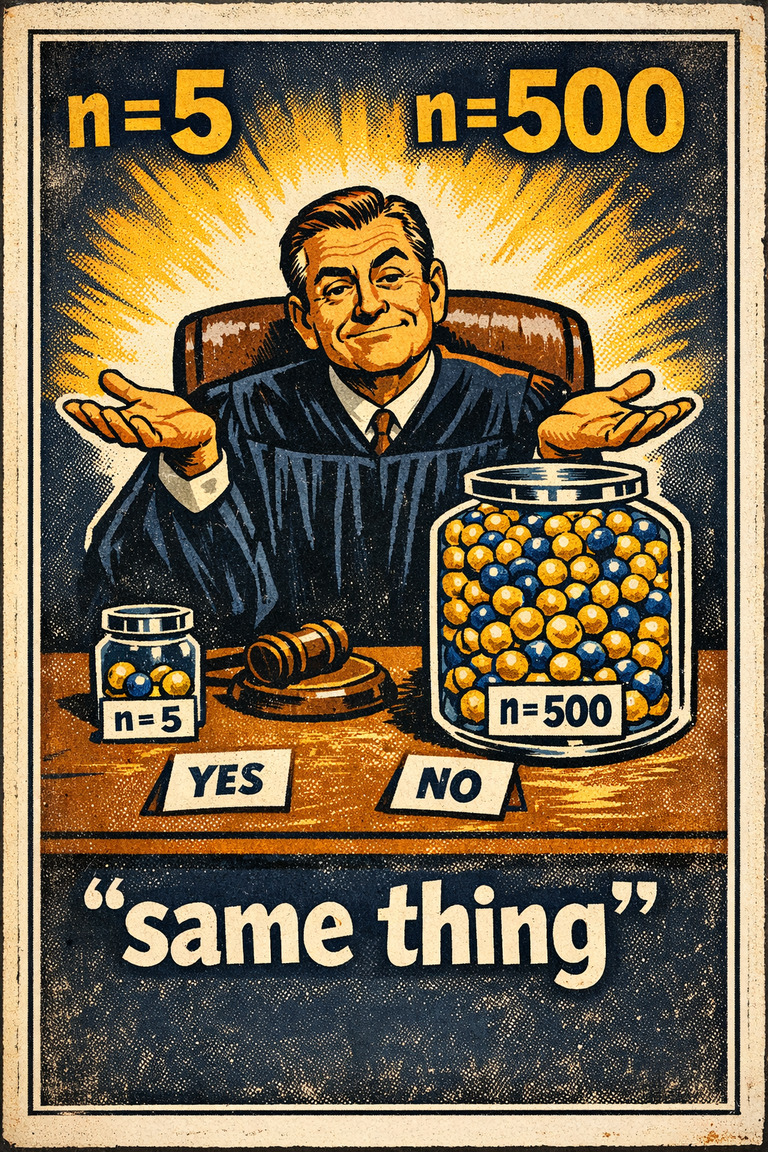
The tendency to judge outcomes without giving enough weight to sample size or quantity.